Dashboard
If you want a summarized, real-time view of the status of your orders within the fulfillment process, this dashboard is ideal for you. It breaks down key metrics showing the number of orders at each stage of the fulfillment flow, accompanied by graphs that provide a visual representation of the processing progress and other relevant data.
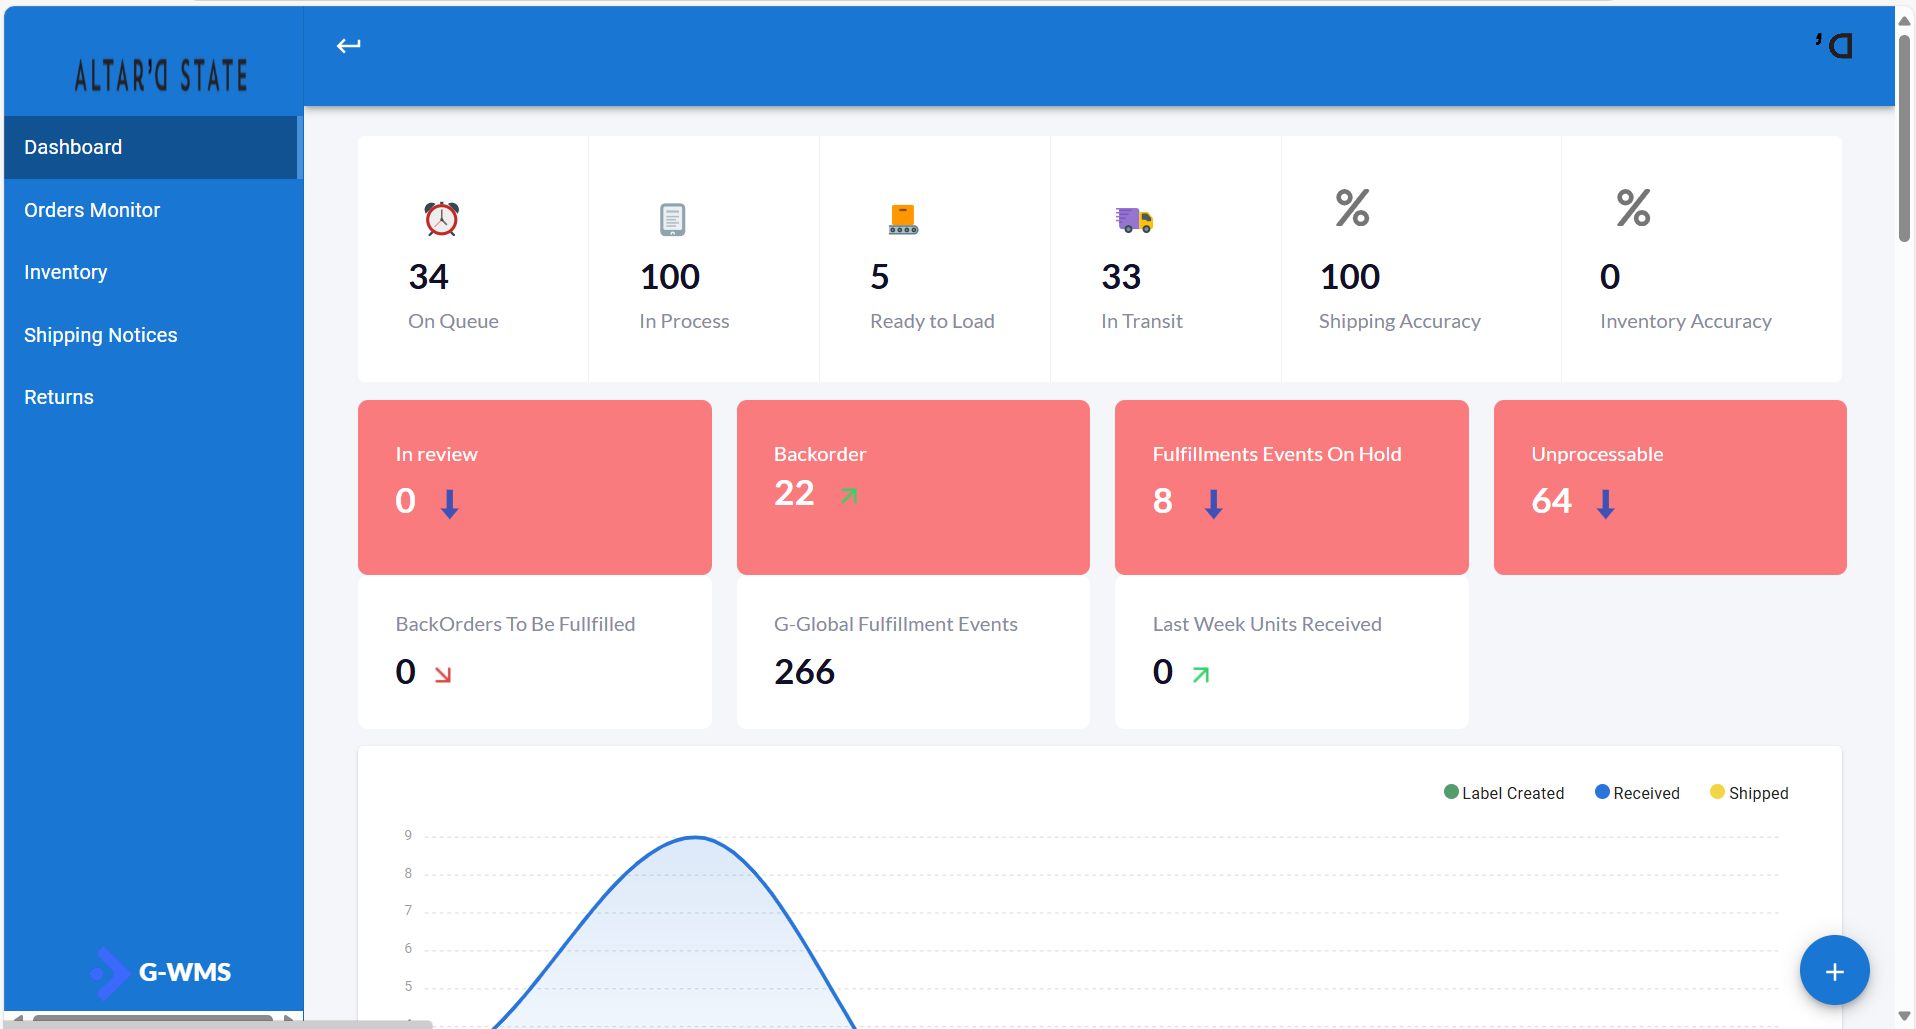
To access this interface, click on Dashboard from the sidebar menu. The following elements will be displayed, as shown in the image below:
Understanding the Metrics
The metrics are presented as cards located at the top of the view. This section shows the number of events by their status within the fulfillment flow, offering a clear and concise view of how your orders are being processed and in which stage they are.
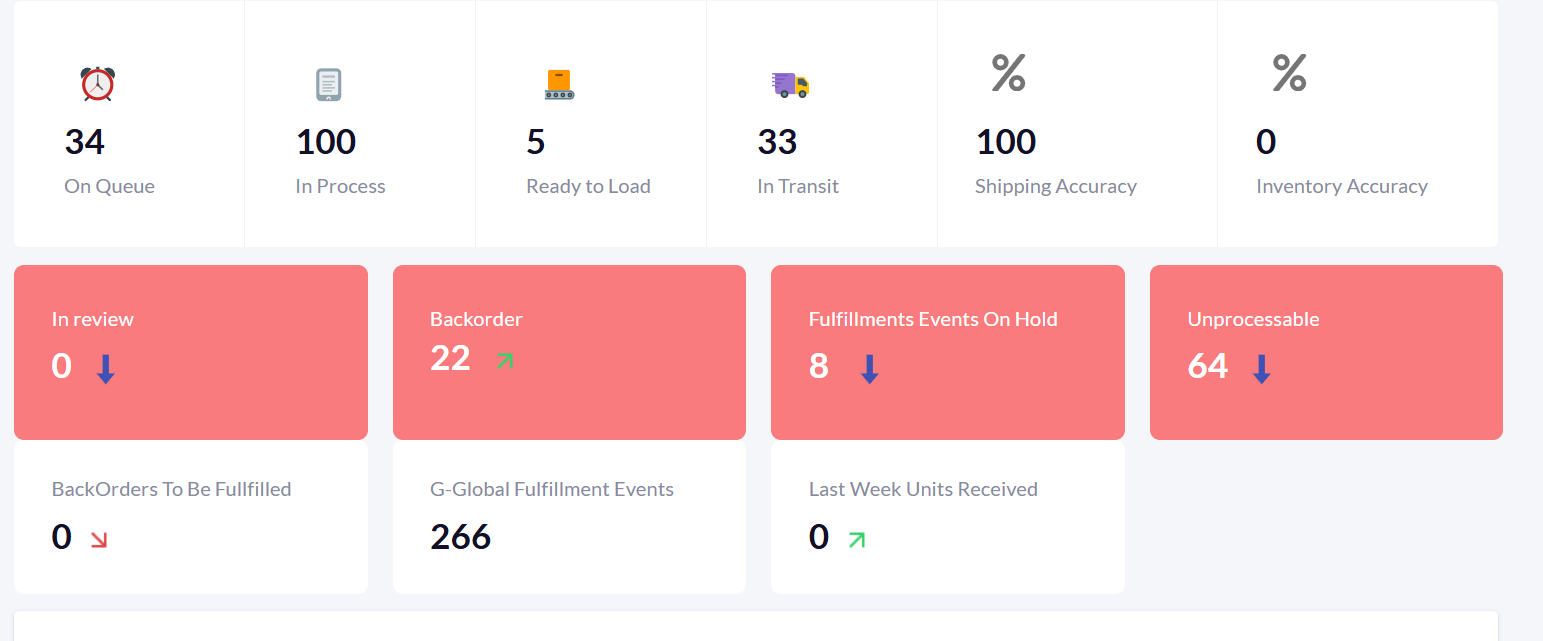
If you click on the cards labeled On Queue, In Process, Ready to Load, or In Transit, you will be redirected to the Orders Monitor, where a filter will be applied showing orders in the corresponding status.
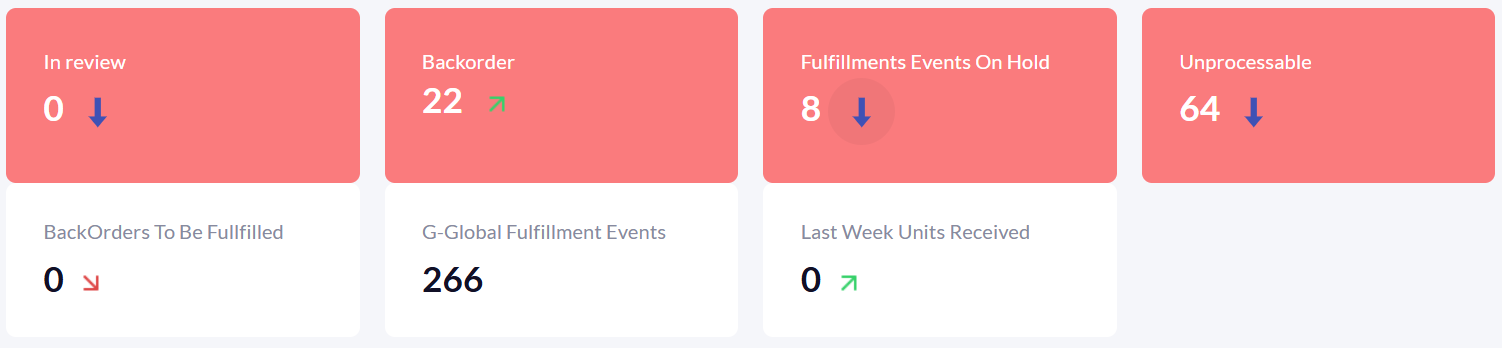
If you click on the Fulfillment Events On Hold card, a modal with several options will appear:
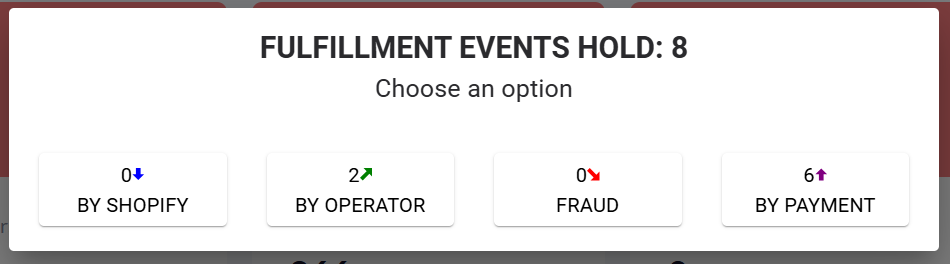
By selecting one of those options, a filter will be applied in the Orders Monitor.
Understanding the Charts
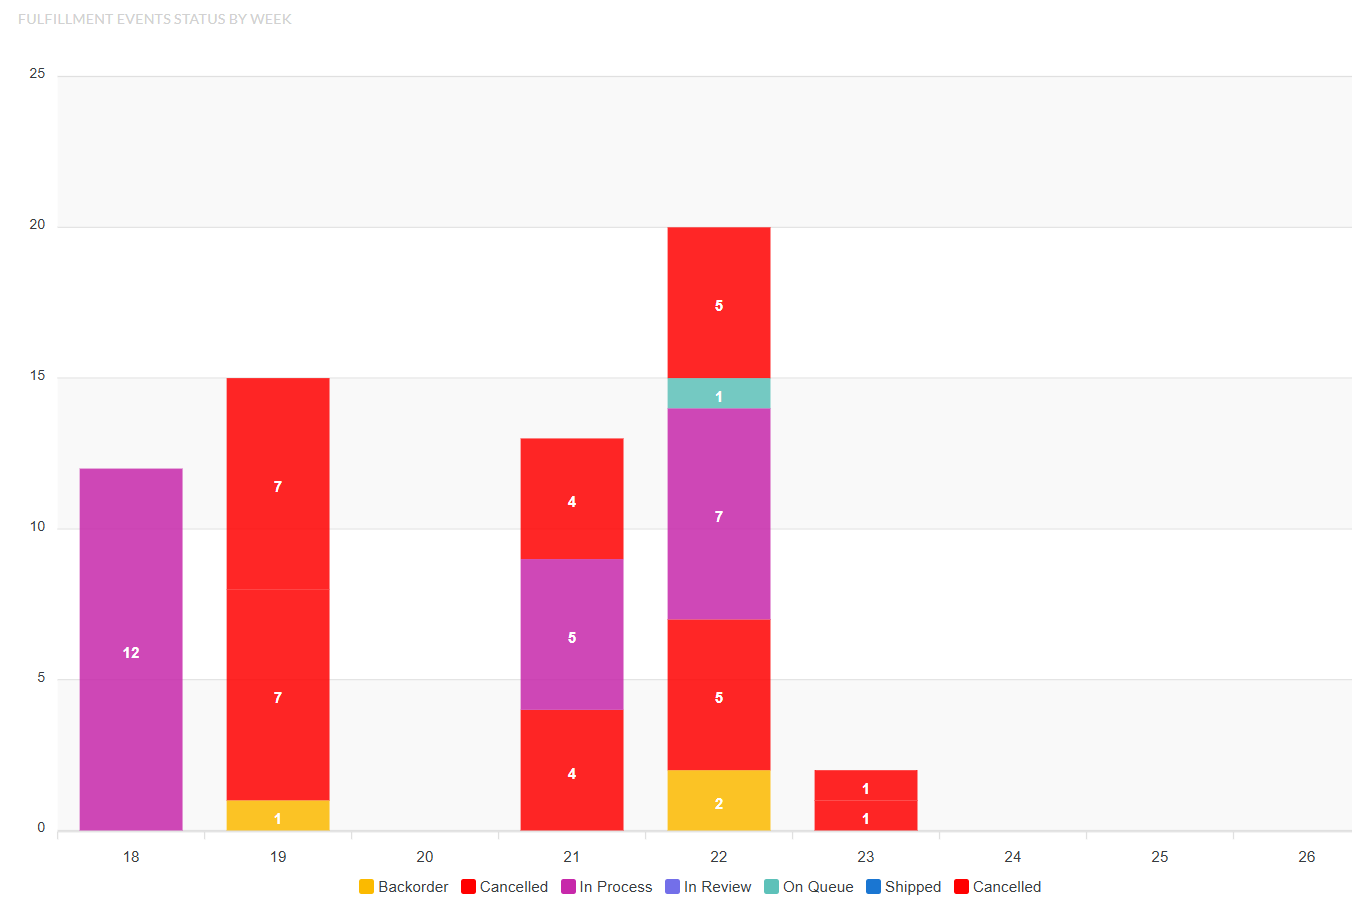
By scrolling down to the bottom of the view, you will find charts showing how fulfillment events are distributed, as seen in the following images:
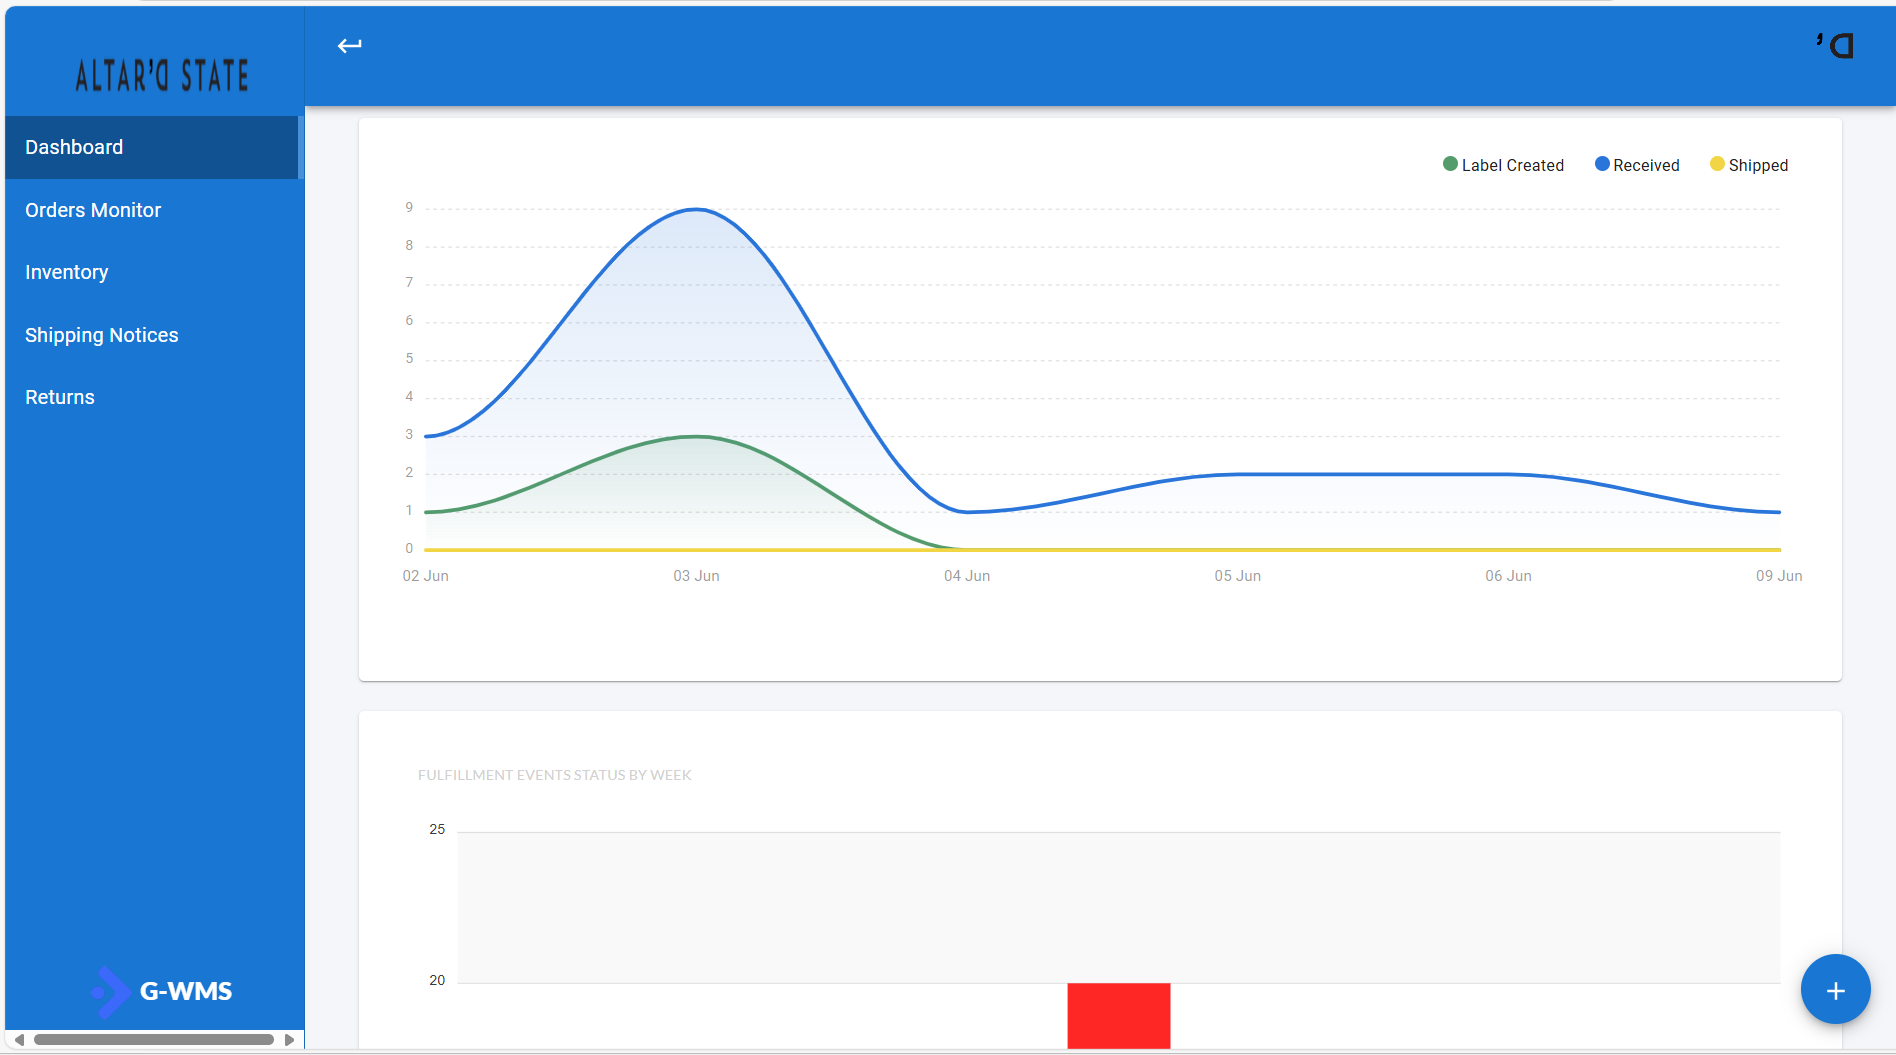
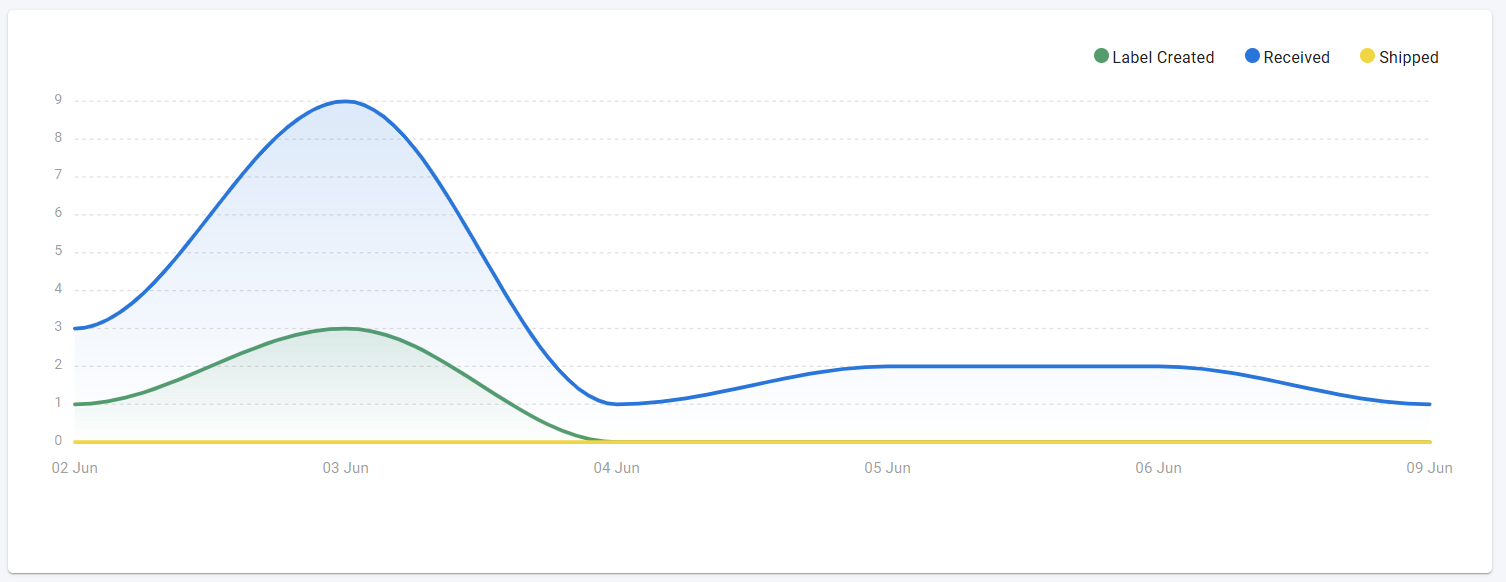
The first chart displays data about Shipped Orders, including the number of packages shipped, labels generated, and packages received per day.
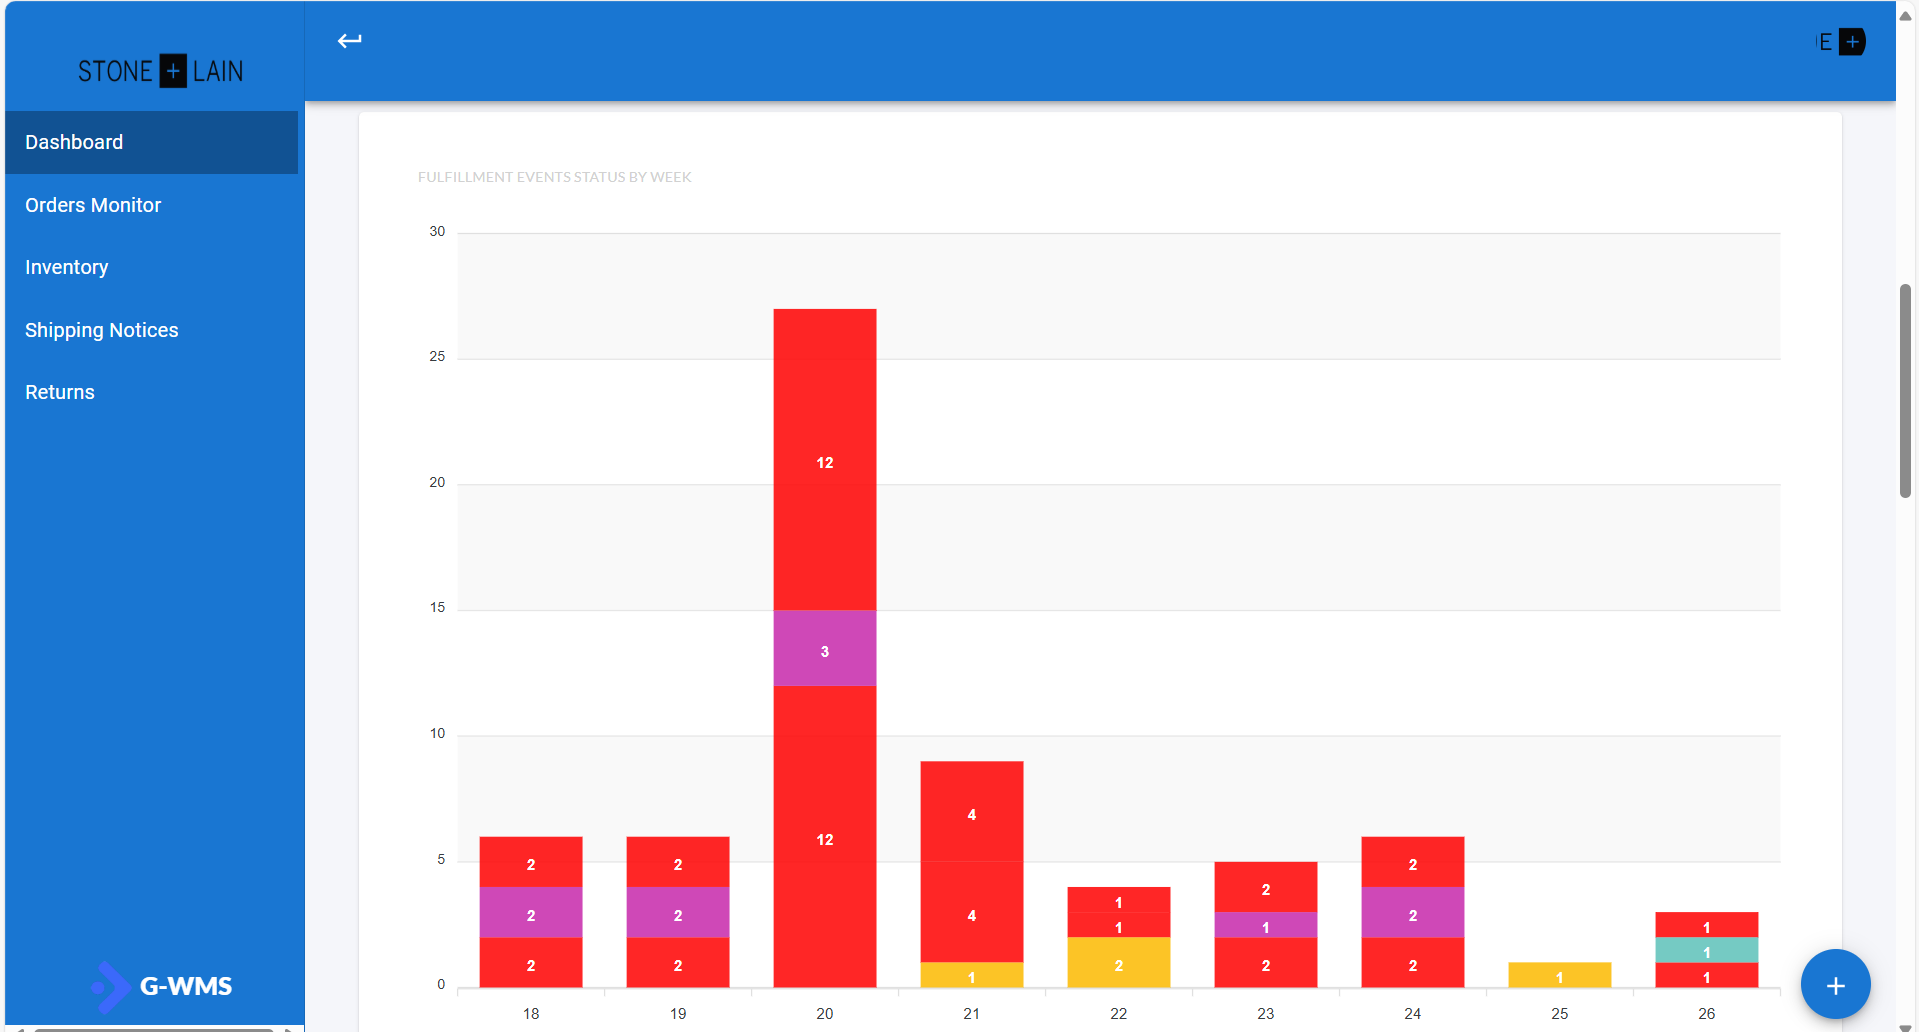
The second bar chart shows the number of events by status—Backorder, Cancelled, In Process, In Review, On Queue, Shipped, and Cancelled—grouped by week.
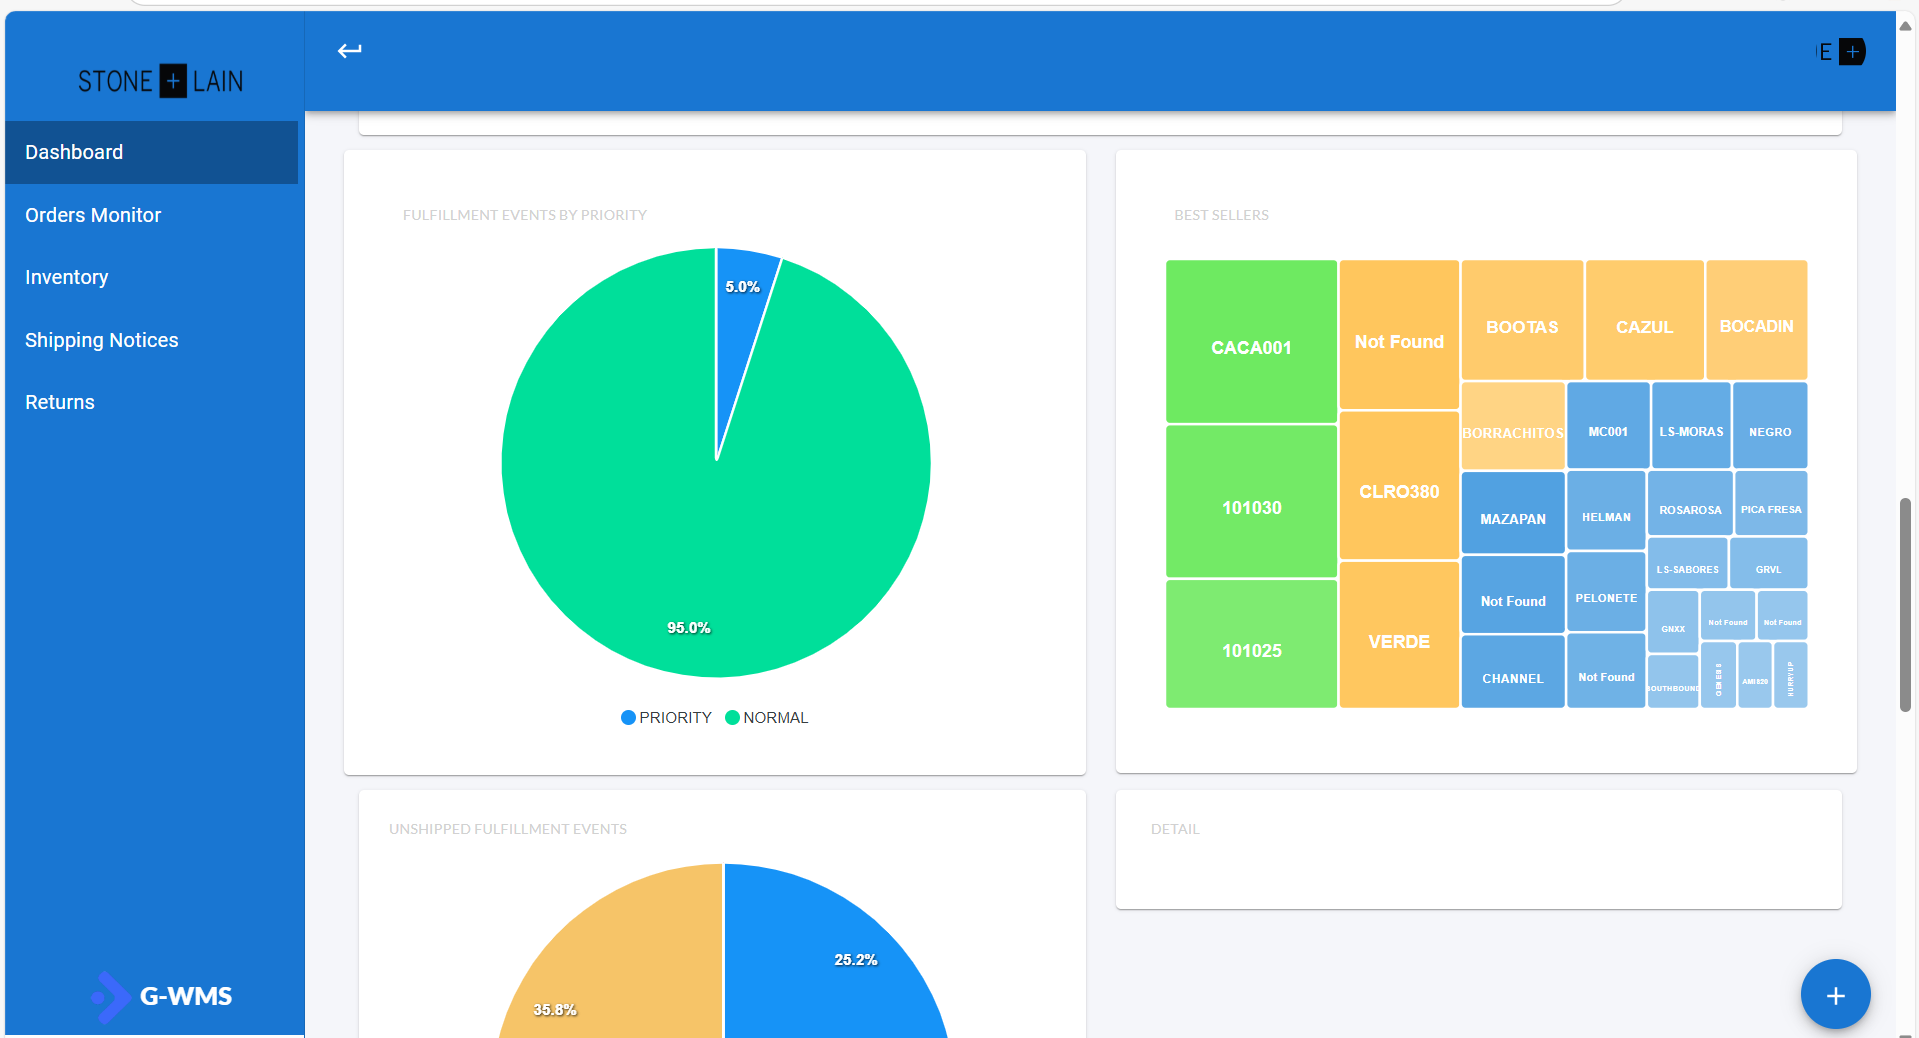
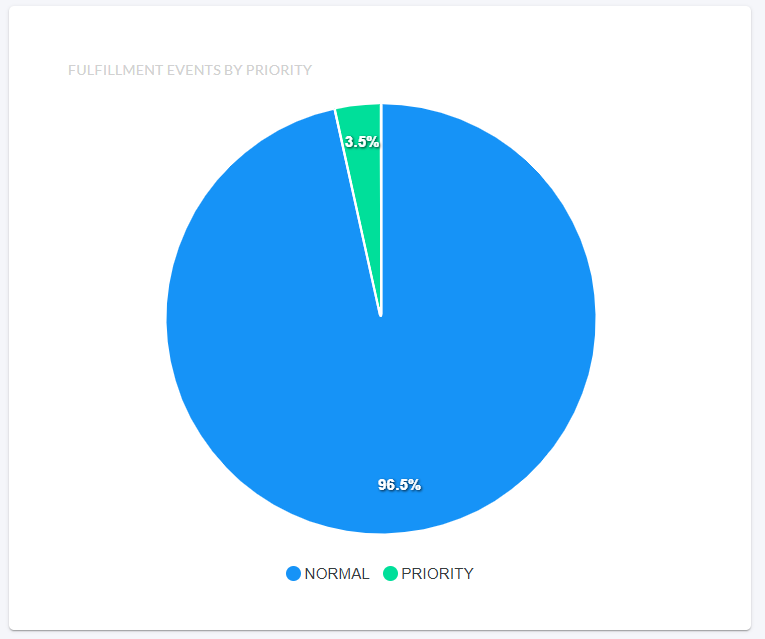
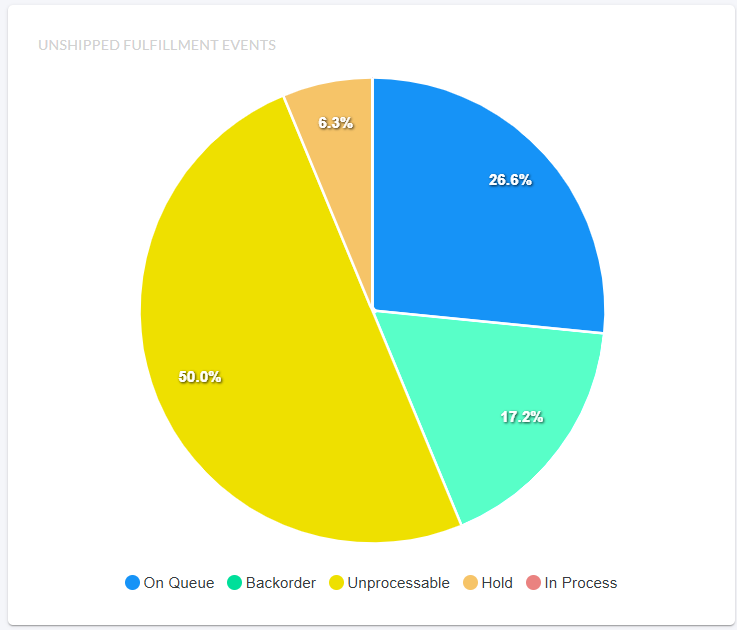
The dashboard also includes pie charts showing the percentage distribution of fulfillment events:
- The first pie chart segments events by priority type, differentiating between priority and regular events.
- The second pie chart displays the percentage distribution of pending fulfillment events, grouped by status.
Configuration Panel
The view also includes a configuration panel whose main function is to enable or disable the display of charts, metrics, and filters. This panel allows you to customize what information you want to analyze in the dashboard according to your needs.
To access the configuration panel, click on the floating button:

Then, a button labeled Dashboard configuration will appear. Click on it to continue.

After that, the configuration panel with its corresponding sections and options will appear, as shown in the image:
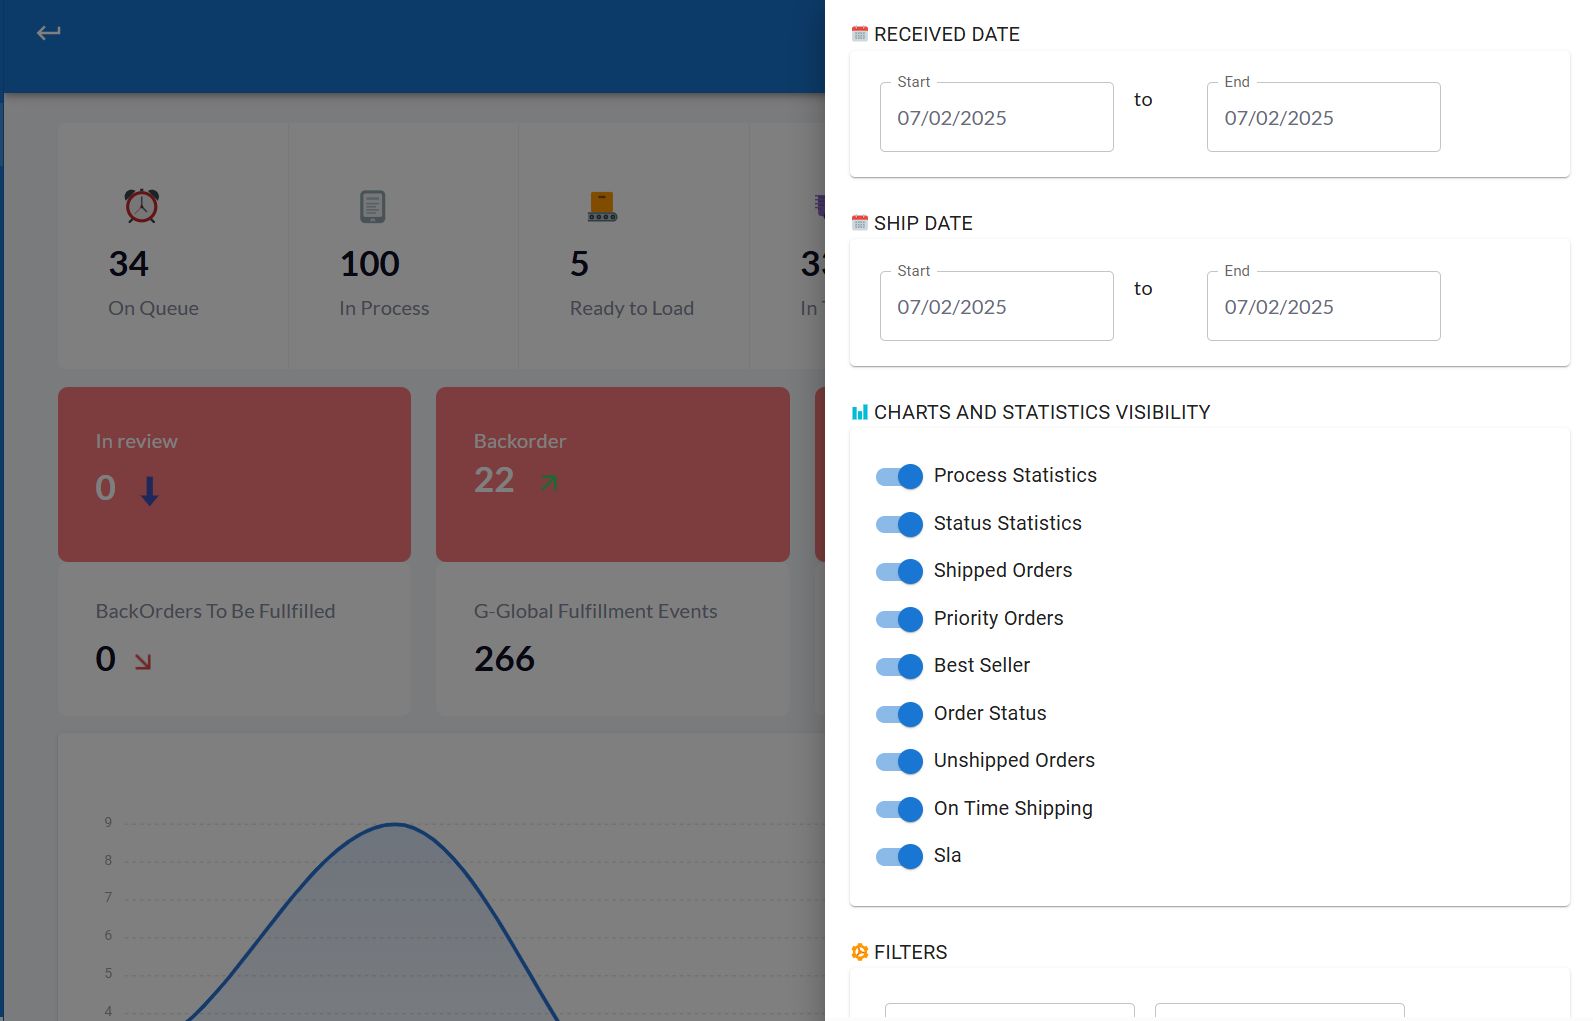
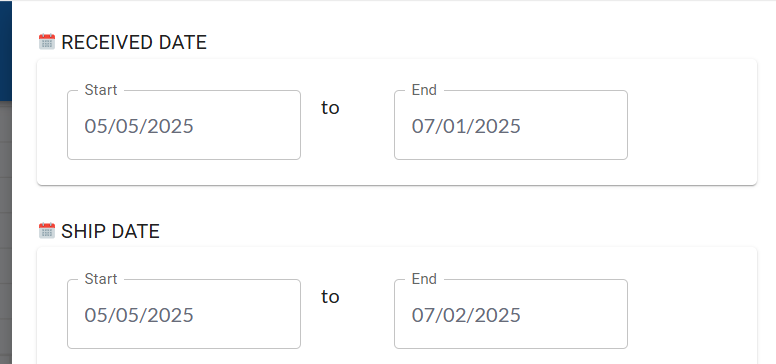
- Date Filters
In this first section, you can apply filters related to inventory receiving and shipping dates.
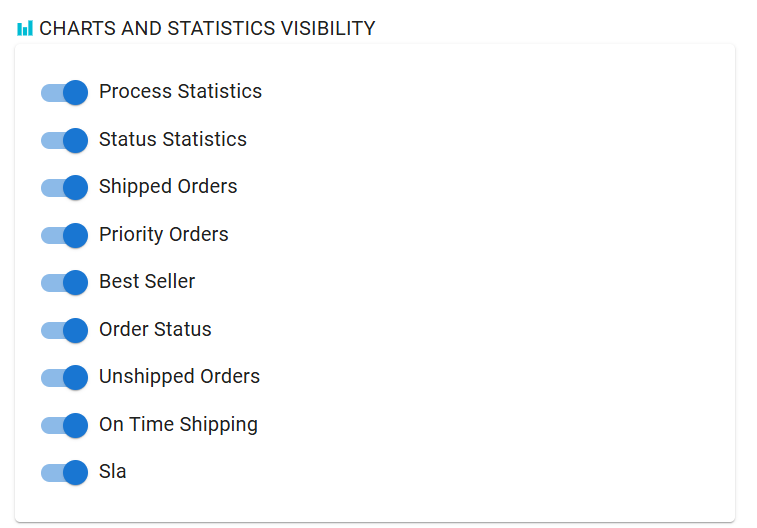
- Chart Settings
This section allows you to enable or disable specific charts you want to view on the dashboard.
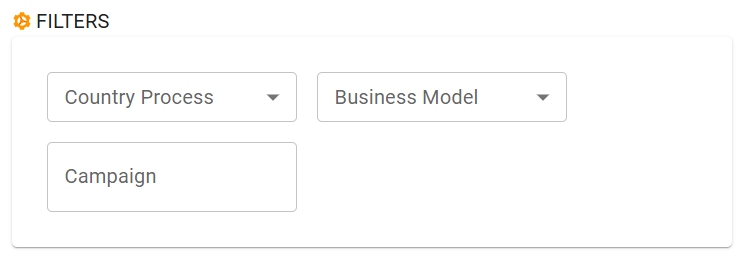
- Additional Filters
Here you’ll find additional filters to refine the information displayed on the dashboard:
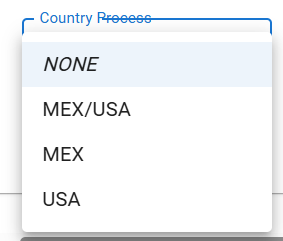
- Country Process: Segments data by the country where the fulfillment process occurs (Mexico or the United States).
- Business Model: Filters the information based on business model: B2B, B2C, or none.

- Campaign: Applies a filter to view only the data related to a specific campaign.
